WEBINAR | Up to 40% Faster Automated TEM Lamella Preparation with new Ga⁺ FIB Column

Non-Destructive 3D Mineral Identification Using Spectral Micro-CT

Spectral CT Imaging for Advanced Ore Characterization in Geological Samples.

hero
hero
Unlocked content

Identifying economically important minerals in geological samples is often limited by the constraints of traditional 2D techniques or grey-level ambiguity in standard micro-CT. TESCAN’s spectral micro-CT workflow eliminates these limitations by enabling high-resolution, non-destructive 3D analysis of both structure and composition. This is ideal for identifying high-Z minerals such as gold, tungsten, or tantalum, even in complex or low-grade samples.

Why Choose Tescan FIB-SEM Workflows

for TEM Sample Preparation?

01
Common Challenges in High-Resolution Geological Imaging

While SEM-EDS and automated mineralogy offer quick surface-based insights, they face several limitations:

  • Lack of 3D Information

Grain size, sphericity, and internal distribution cannot be captured from a single plane.

  • Undetected Trace Phases

Minerals may go unnoticed if they’re not intersected by the prepared section.

  • Sampling Bias from Density Settling

In resin mounts, heavier minerals like galena or gold may sink during curing, distorting abundance data.

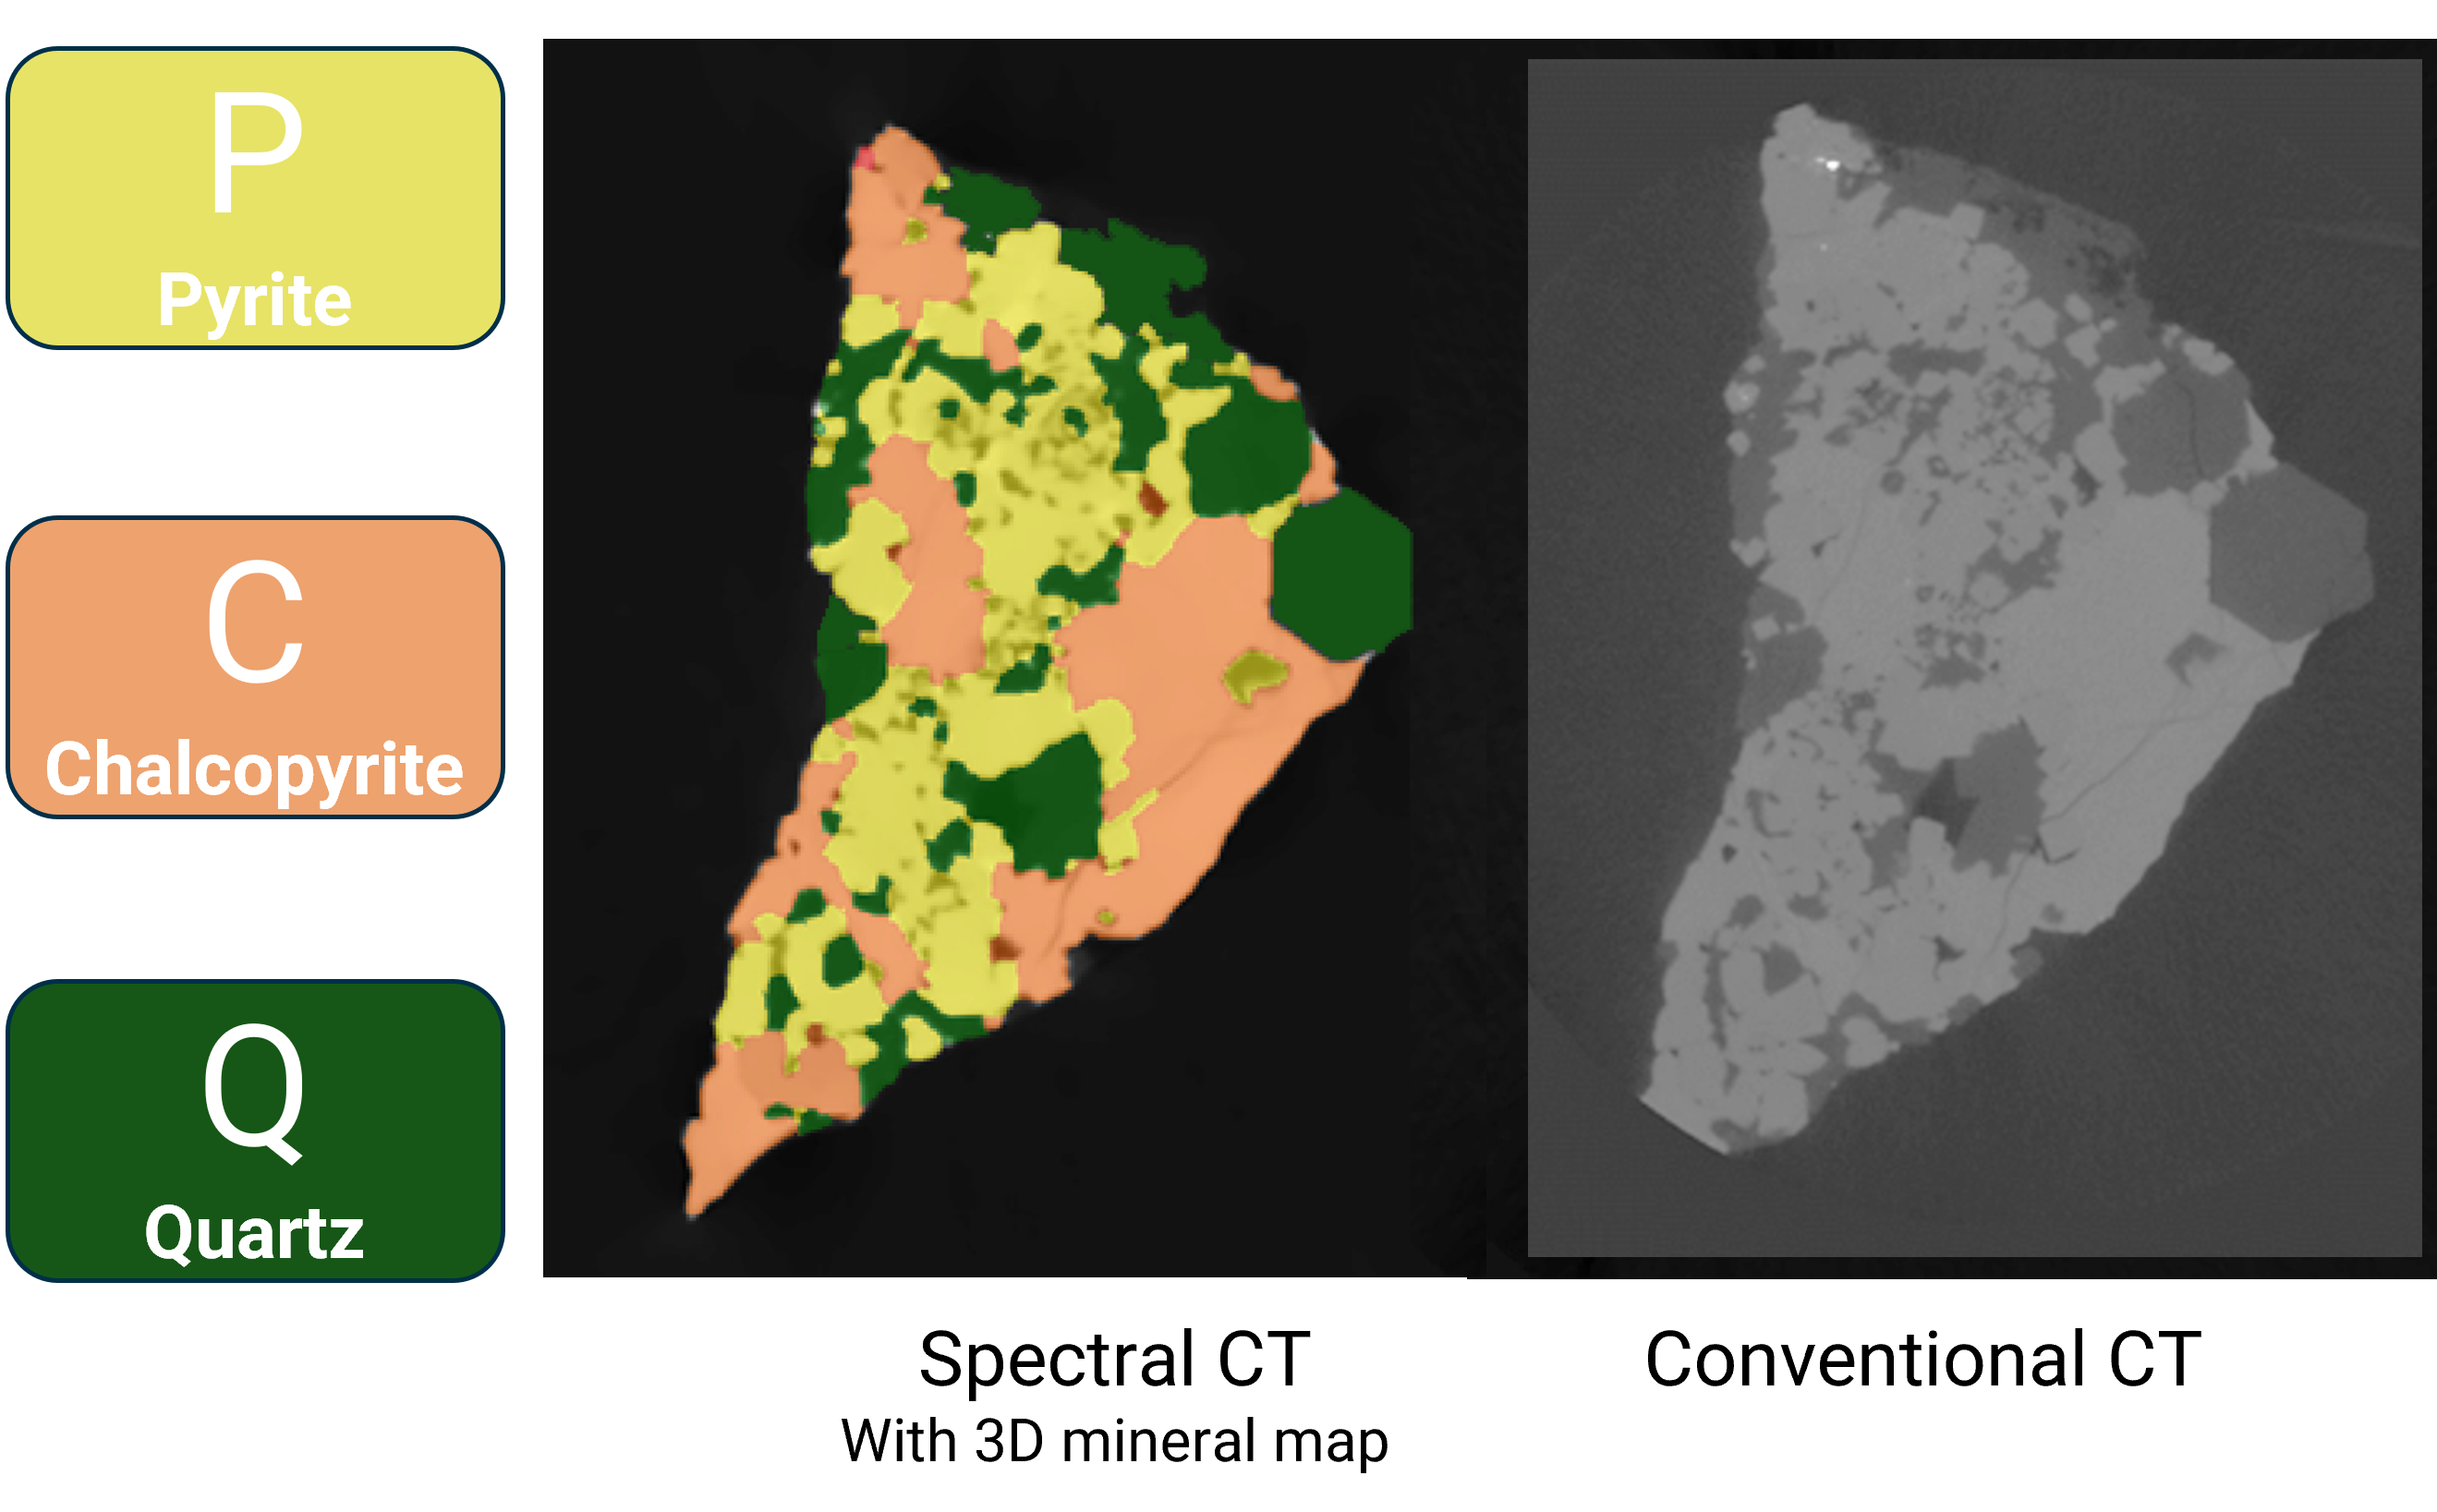
  • Poor Phase Contrast in Conventional CT

Minerals with similar attenuation, like pyrite and chalcopyrite, are indistinguishable, limiting analysis.

These issues compromise both the accuracy and representativeness of mineralogical data used for resource evaluation.

The Benefits of Using Spectral Micro-CT

Resolve Overlapping Attenuation Profiles

Spectral CT differentiates minerals like pyrite and chalcopyrite using complete X-ray attenuation curves instead of averaged grey levels.

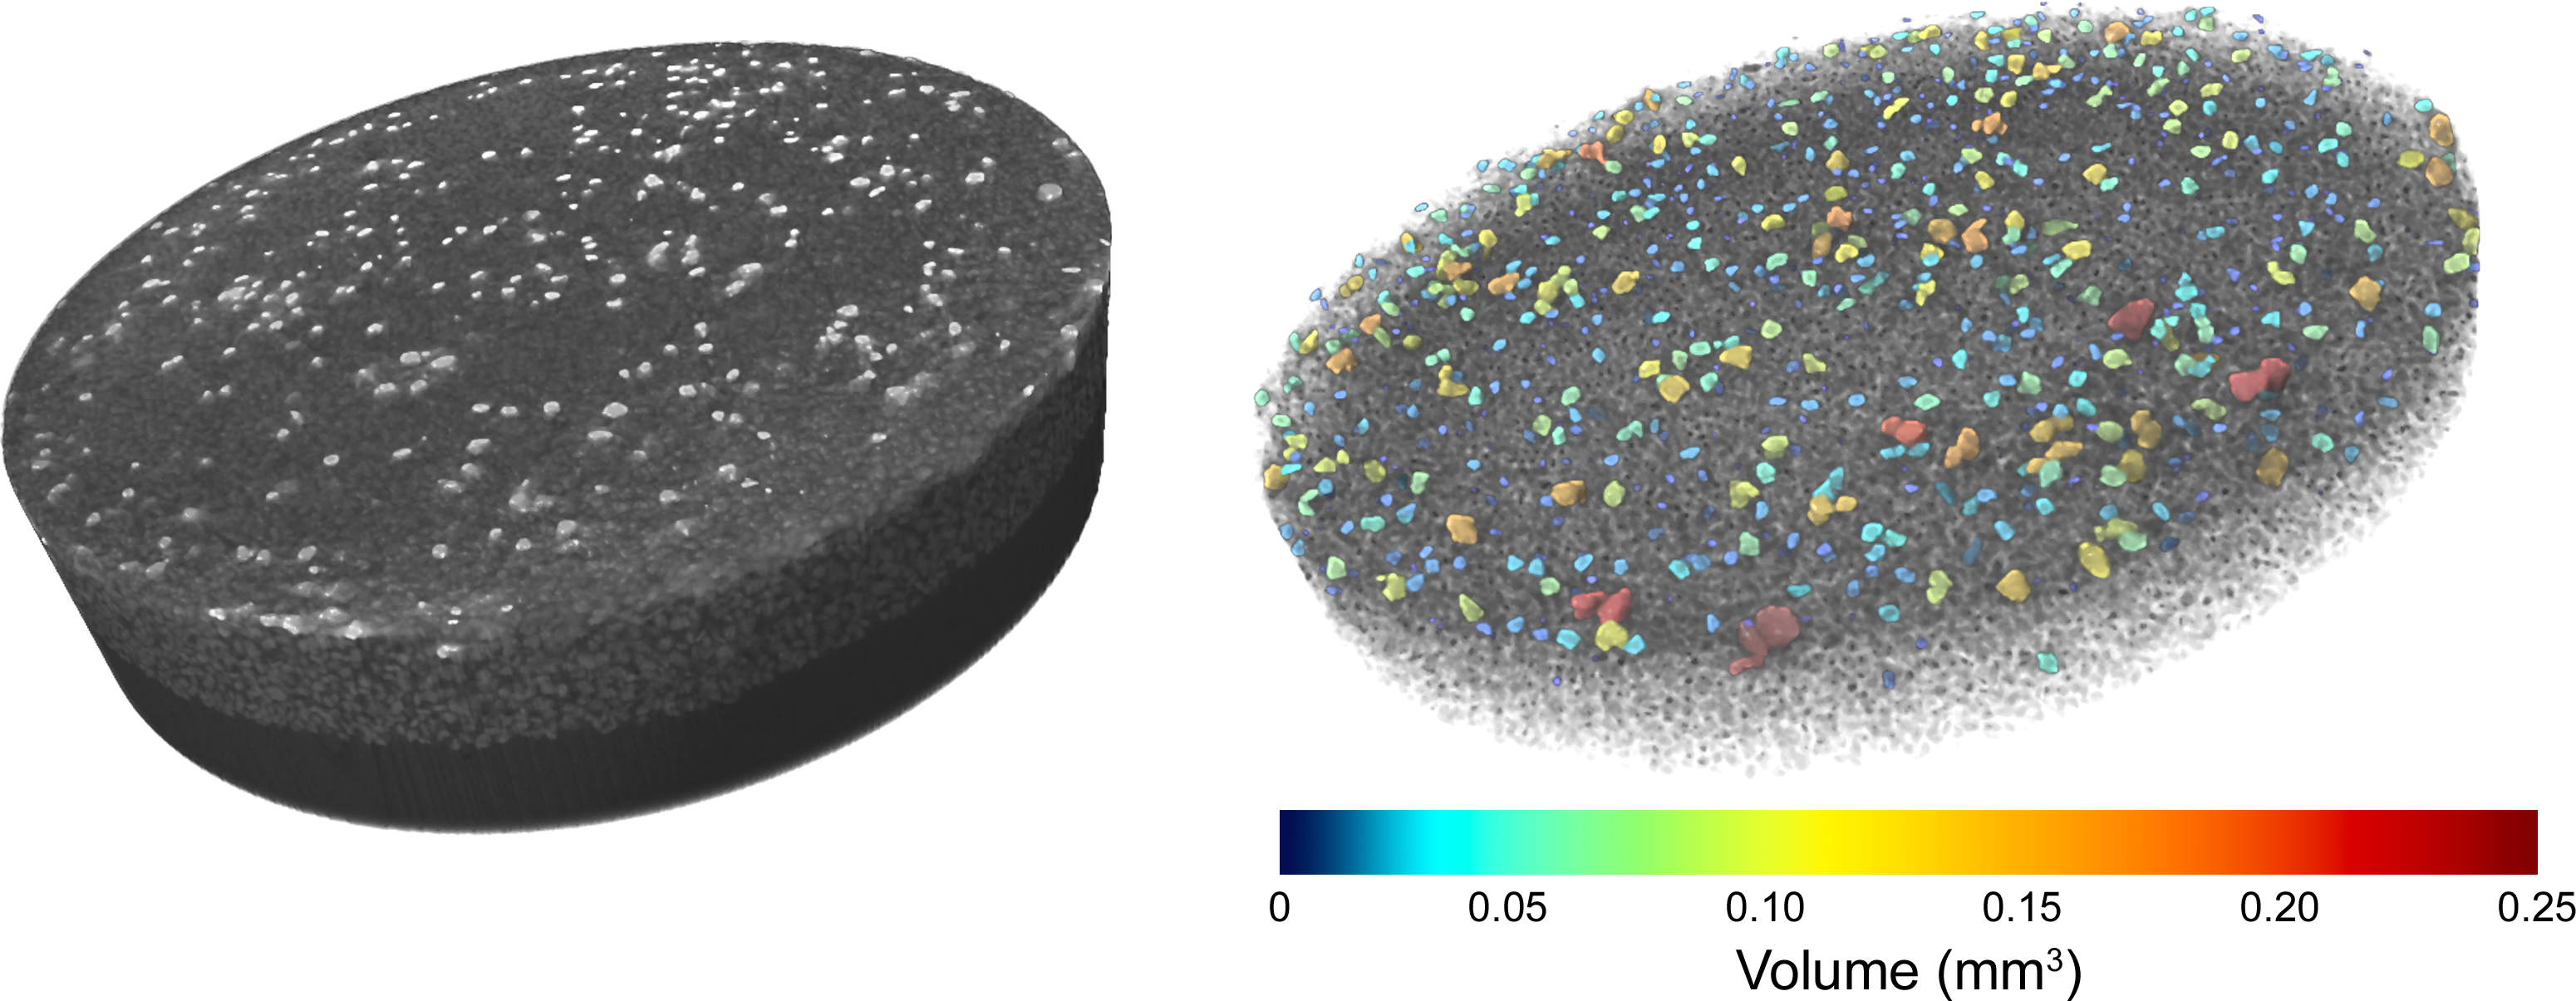
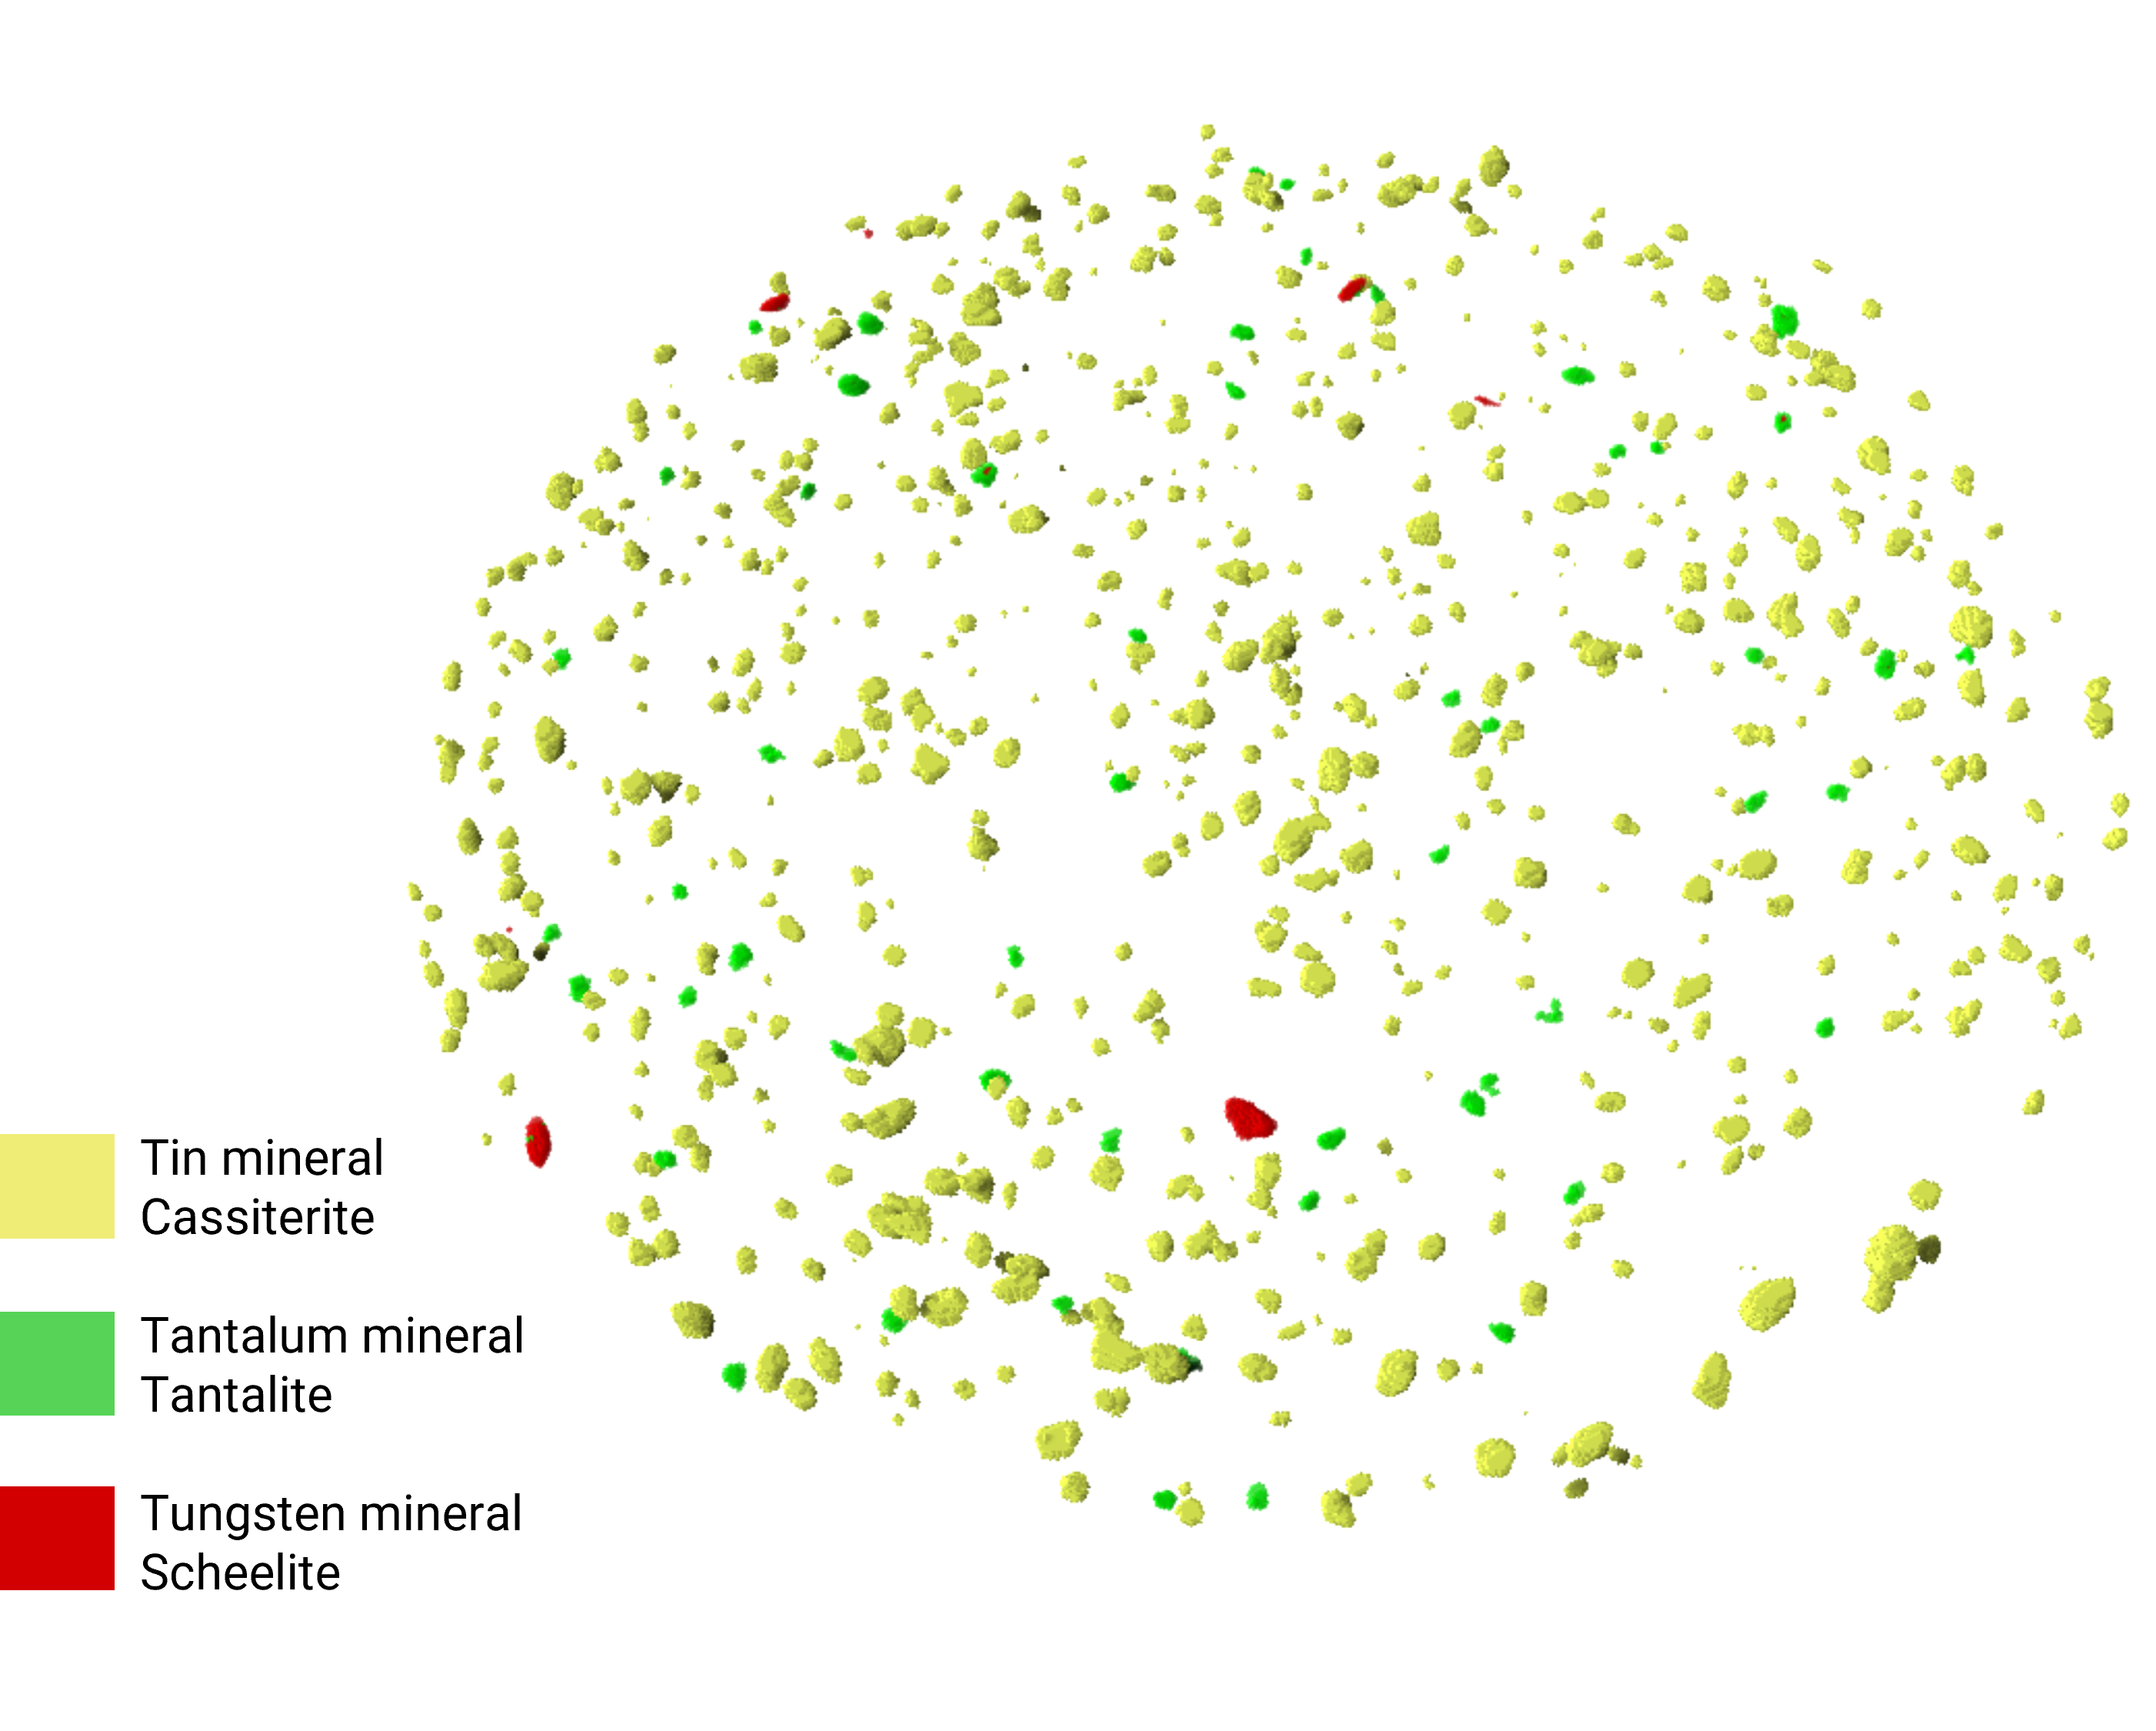
Quantify Low-Concentration Minerals in 3D

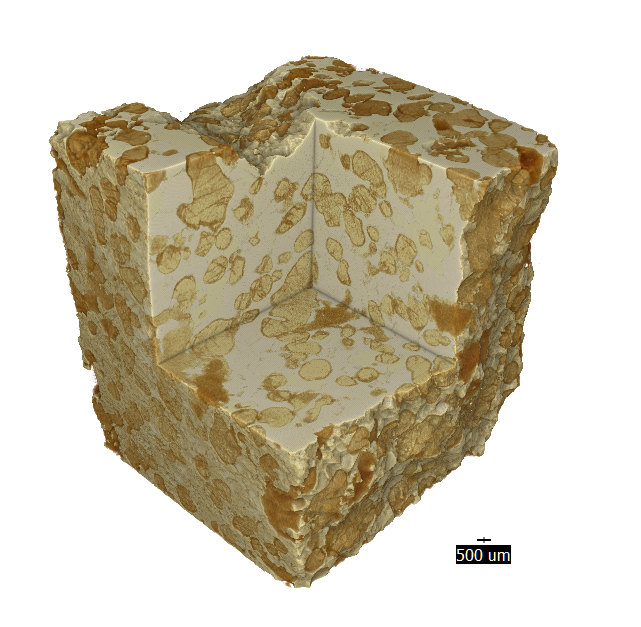
Assess volume fractions of gold, tantalite, scheelite, or galena inside entire core samples or grain mounts without destructive prep.

Correct Sampling Bias from Resin Mounting

Visualize particle density gradients across the sample and retrieve accurate mineral distributions regardless of settling.

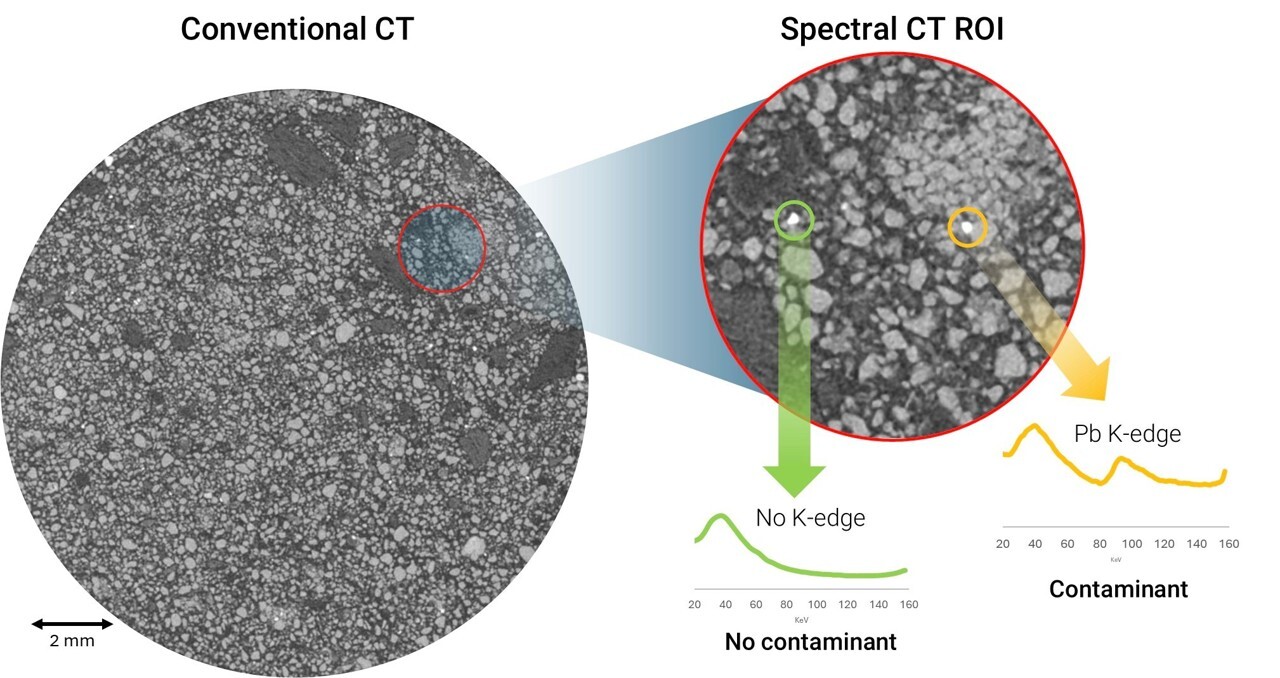
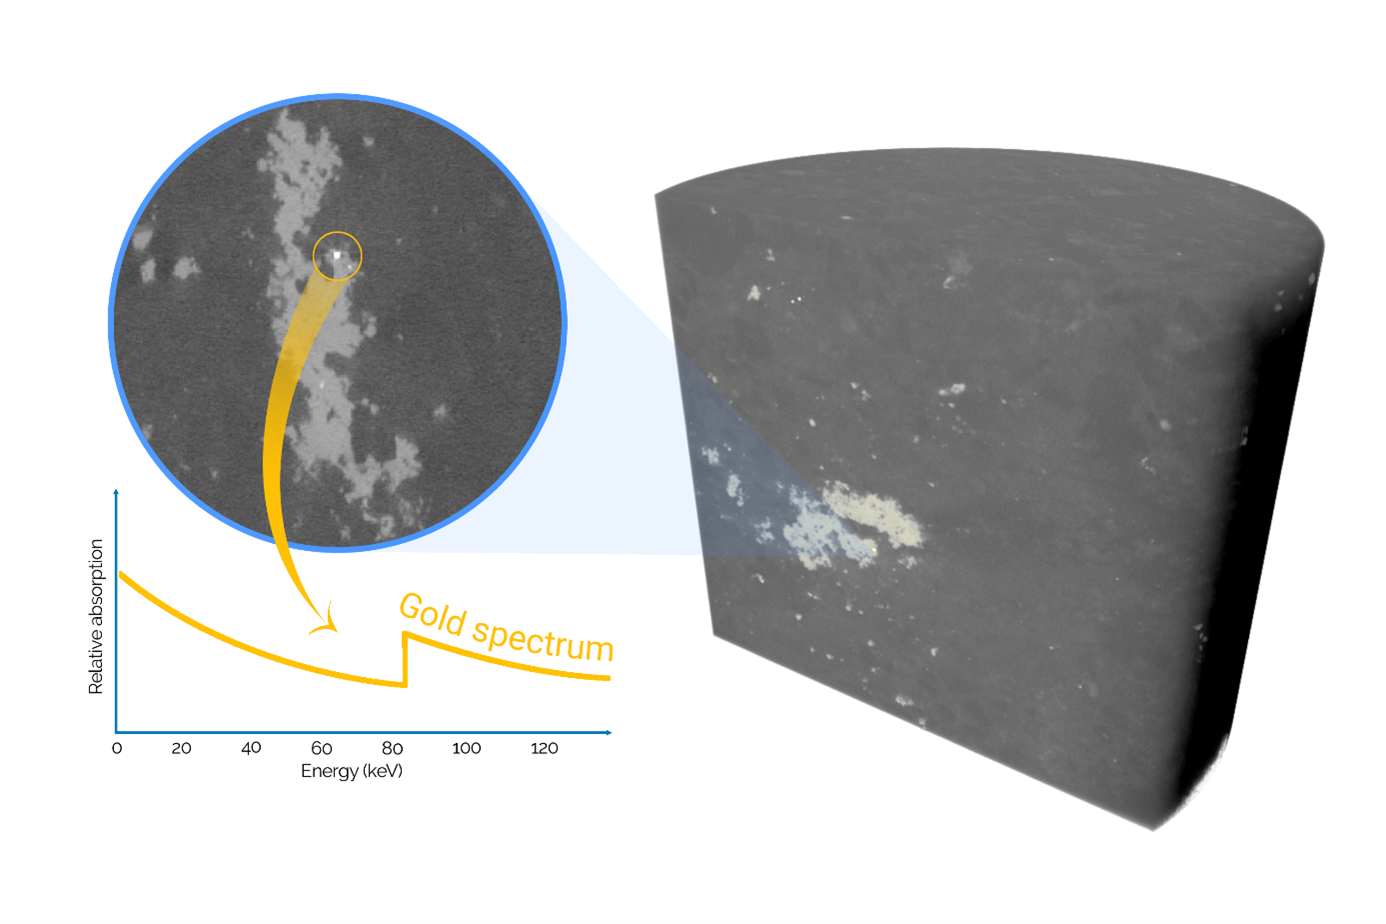
Enable Elemental Detection Using K-Edge Imaging

Identify heavy elements like Pb, W, Ta, or Au based on their absorption edges in the X-ray spectrum.

02
Workflow Description

TESCAN’s spectral CT workflow combines energy-resolved X-ray imaging with full-volume 3D acquisition to characterize ore materials both structurally and chemically.

Step-by-Step Workflow

  • Sample Preparation: Load grain mounts, intact cores, or crushed rock fragments directly, without requiring polishing or embedding.

  • Conventional CT Scan: Perform structural imaging to identify zones of interest and obtain overall mineral distribution patterns.

  • Spectral CT Acquisition: Capture photon-resolved attenuation data using the PolyDet II detector over 140 energy bins.

  • K-Edge and Zeff Mapping: Extract material-specific features from attenuation curves to identify and segment minerals with similar densities.

  • Quantification and Visualization: Use TESCAN Spectral Suite and ORS Dragonfly to measure volume fractions, sphericity, and spatial orientation of target phases.

03
Method in Focus

At the core of this workflow is TESCAN’s spectral micro-CT technology, which provides:

01
Full-Spectrum Attenuation Curves: For every voxel, the PolyDet II detector captures an energy-resolved signal between 20–160 keV.
02
K-Edge Elemental Identification: Detect characteristic absorption edges—for instance, Pb at 88 keV, W at 69.3 keV, and Ta at 67.4 keV.
03
Absolute Density and Effective Atomic Number (Zeff): The curve shape reflects Zeff; the curve height reflects density. This allows separation of nearly identical minerals like scheelite and tantalite.
These capabilities make spectral CT ideal for compositional mapping in samples where conventional grey-level segmentation fails.

04
Use Case in Geo Science

Sulfide Sample: Galena, Pyrite, Chalcopyrite

Spectral CT resolved galena using Pb K-edge contrast and distinguished between pyrite and chalcopyrite based on Zeff and density, while conventional CT could not.

Grain Mount: Tantalite, Scheelite, Cassiterite

Traditional resin mounts showed particle clustering and settling bias. Spectral CT corrected volume estimates and separated Ta- and W-bearing grains via K-edge imaging.

Core Sample: Gold Detection in Field Rock

A 5 cm core slice was analyzed for gold. Spectral CT positively identified 80 µm grains using gold’s 80.7 keV absorption edge—demonstrating the method’s ability to detect low-concentration, high-value phases even when partially obscured.

These examples highlight how spectral CT enables confident mineral discrimination across a wide range of geological applications.

GET IN Touch

Contact us

Get the most out of Tescan

This is more than information; it's an advantage. We've compiled our technical whitepapers, detailed product flyers, and on-demand webinars to provide you with the knowledge that makes a real difference. Sign up now to access the insights you need to make an impact.

Tescan Instruments & Technology

Used in This Workflow

TESCAN UniTOM XL

Large-Volume Dynamic Imaging for Geological and Ore Samples

TESCAN UniTOM XL enables high-resolution, wide-field scanning of full-size rock cores and grain mounts with optional spectral capability.

  • Dual-detector system: conventional and spectral CT

  • Supports both structural and chemical characterization

  • Ideal for unprocessed drill core and mounted ore samples

MICRO_UniTOM_XL_1-2

TESCAN PolyDet II (Spectral CT Detector)

Energy-Resolved Detector for Elemental Imaging in 3D

The TESCAN PolyDet II detector transforms standard micro-CT into a spectral imaging platform able to detect elemental signatures across an entire volume.

  • Photon-counting detection with 140 energy bins

  • 20–160 keV spectral range

  • Enables K-edge imaging, density, and Zeff mapping 

GET IN Touch

Contact us

map

Where can you find us:

Tescan Brno
Libušina třída 21
623 00 Brno
Czech Republic

info@Tescan.com